

































What OEE measures and why you should capture it automatically
OEE stands for Overall Equipment Effectiveness. It tells you in a single figure how much of your planned production time actually turns into good parts. Losses from downtime, slow cycles and scrap become visible and comparable.
OEE is only reliable if runtimes, part counts and stoppages are captured automatically at the machine. Handwritten downtime logs miss short stops and only arrive at the end of the shift. How to capture cycle times, utilization and throughput at the machine is covered in a separate use case. OEE links Condition Monitoring with Quality Management: it shows whether and how fast a line is producing, and how much of that output is good.
On this page you will find 12 projects in which companies capture and improve OEE or its components availability, performance and quality, including the users, implementation partners and technology involved. In the text we describe selected projects, including some from related topics.
How to calculate OEE: formula and example
OEE is the product of three factors:
OEE = Availability × Performance × Quality
- Availability: actual run time divided by planned production time.
- Performance: parts produced times ideal cycle time, divided by run time.
- Quality: good parts divided by all parts produced.
An example: a shift is planned at 480 minutes and the machine is down for 72 of them. That leaves 408 minutes of run time, so availability is 85 %. With an ideal cycle time of one minute, 408 parts would have been possible; 367 were produced. That is 90 % performance. Of those 367 parts, 356 are good, so quality is 97 %. OEE comes to 0.85 × 0.90 × 0.97 = roughly 74 %.
The hard part is not the maths. It is getting the input values without anyone keeping tally sheets.
Capturing OEE automatically: three ways to get machine data
Tap existing signals without touching the controller
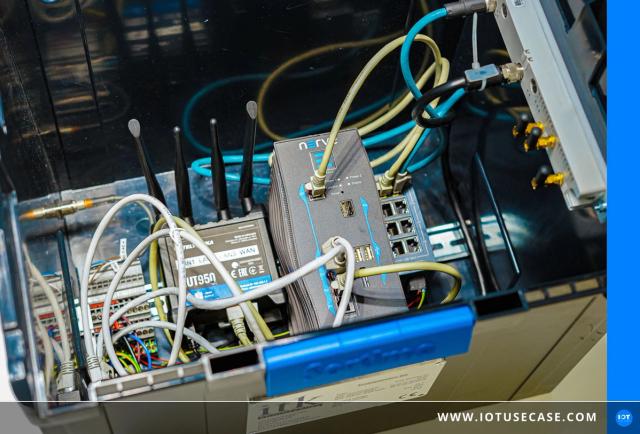
At RAFI Hungaria, the digital outputs of the end-of-line tester on each assembly line are connected to a KIS.ME signal light. If no new test result arrives for one minute, the workstation counts as idle. From this the system calculates availability including short stops, performance against the target quantity, and first-pass yield. Setup took less than a day, and one light per line is enough.
ZARGES counts products on two robot lines for welding and punching with light barriers connected via Peakboard Edge. Because nobody touches the PLC, warranty and CE marking stay intact. A chocolate manufacturer uses an OEE adapter from Perinet and Zentinel on its packaging lines to capture speed, good and rejected parts, and run and downtime. On a PET blow moulding machine with no digital interface, the same approach counts preforms and finished bottles and reports jams at the machine outlet.
Derive machine status from power and process data
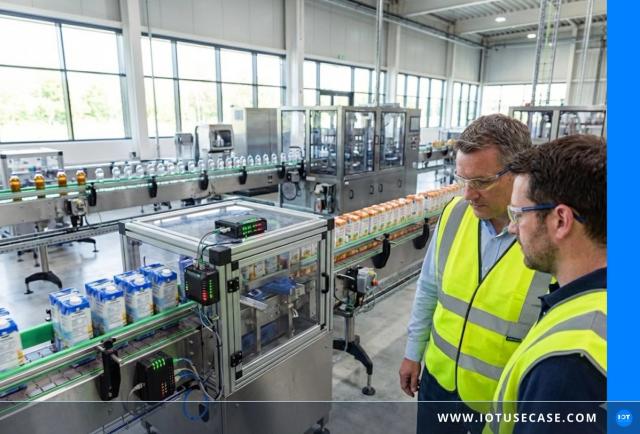
A manufacturer of beverage and food packaging uses the HUB-EN200 from in.hub to capture power and process data on six lines. The system automatically assigns the data to the states production, idle and downtime, and passes it on to the ERP system and local dashboards.
Connect controllers, control systems or the whole machine park
Where the data already sits in the controller, you can collect it via standards such as OPC UA or MQTT. At the Bosch Rexroth plant in Lohr, ITK Engineering captured more than 40 signals from a milling machine, including part counters, machine status and error messages. A clean fault signal turned out to be decisive for availability. Greiner Packaging has connected around 500 machines in 11 plants via Kepware and the OPC Router from inray. The data now arrives in real time around the clock instead of being collected overnight from an old system.
OEE projects and what they achieved
- Packaging production with in.hub: 15 % less unplanned downtime, 220 hours of additional production time and a benefit of more than €18,000 per year. The €5,900 investment paid for itself after four months.
- Food production with ENLYZE: with automatic downtime capture as part of a planned single OEE standard across all sites, OEE at the pilot site rose by 14 percentage points. The same data foundation cuts electricity costs by more than €60,000 a year through peak load management.
- Assembly lines at RAFI Hungaria: OEE on one line for command devices rose by 8 %. That is around 200 more parts and €2,000 more revenue per day, on that line alone.
- Tofaş automotive plant with ThingWorx: 12 % higher OEE and 23 % less scrap.
- Cosmetics production at Unifarco with the X Platform from Exor: 10 percentage points more OEE, more than 30 % higher productivity and 99.8 % paperless production.
At protective packaging manufacturer Storopack, the ENLYZE app shows around 7,000 machine parameters together with the order context. That way employees spot problems faster, even on the night shift, although the machines are spread across two halls far apart from each other.
OEE dashboard and OEE software: what matters
OEE only makes a difference once the right people see it at the right time. The projects implemented so far show what OEE software should deliver:
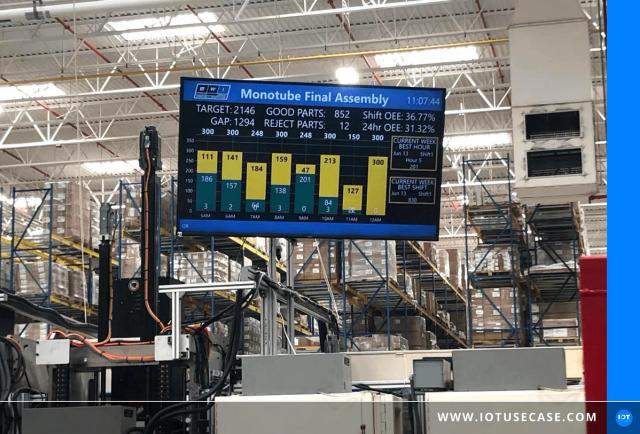
- Live view at the line: at ZARGES the dashboards refresh every two to ten seconds, and the solution runs entirely on the local network.
- Alerts on your phone: a food manufacturer connected six production lines, from mixing to packaging, with Itanta Analytics. OEE is calculated live, an app reports deviations, and manual entries have been eliminated completely, without a single line of code.
- Causes, not just numbers: downtime reasons, error messages and order data belong next to the OEE figure. Otherwise it stays unclear where to start.
- Open interfaces: data should flow into ERP, MES and BI systems via REST, MQTT or SQL.
- For machine builders too: SEMA Technology Group shows its customers OEE dashboards of their own machines in the field through a service portal built with blue-zone.
You can find more on tools for live dashboards in the building block Data visualization. If you want to use machine data for maintenance next, take a look at Predictive Maintenance; for the quality side of OEE, see Waste reduction.
Five steps to automatic OEE tracking
1. Pick the bottleneck. Start with the line or machine that limits your output.
2. Agree on definitions. What counts as planned production time, what is the ideal cycle time, what is a good part? Without shared definitions, OEE figures are not comparable.
3. Clarify the signals. Are there counters, test results or states in the controller, or do you need a light barrier, current sensor or external adapter?
4. Run a pilot. One line, a few weeks, and capture downtime reasons from day one.
5. Roll out and improve. Connect more lines and sites to the same standard and tackle the biggest losses one by one.
How to spot the right partner
- They have captured OEE on a comparable machine and can show you what it achieved.
- They can capture data without touching the controller if your machines require it.
- They help you define availability, performance and quality, not just with the hardware.
- Their software shows downtime reasons and connects to ERP and MES through open interfaces.
Tell us briefly what you are planning, and we will put you in touch with providers who have already implemented OEE tracking on comparable equipment.
Frequently asked questions about OEE
What does OEE mean?
OEE stands for Overall Equipment Effectiveness. It shows what share of planned production time has turned into good parts. The metric combines availability, performance and quality. 100 % would mean producing without interruption, at ideal speed and with no scrap at all. Every percentage point below that is a loss you can trace back to a cause.
How do I calculate OEE?
You multiply availability, performance and quality. Availability is run time divided by planned time, performance is part count times ideal cycle time divided by run time, and quality is good parts divided by all parts. With 85 % availability, 90 % performance and 97 % quality, you get roughly 74 % OEE. Automatically captured count and status signals give you these values continuously instead of once per shift.
How do I capture OEE on older machines without an interface?
You use signals that are already there or add them from the outside. At RAFI Hungaria the outputs of a test device provide the basis, at ZARGES light barriers count the parts, and at in.hub power and process data show whether a line is producing, idling or stopped. On a PET blow moulding machine without a digital interface, an adapter counts preforms and bottles. At ZARGES, RAFI Hungaria and on the PET blow moulding machine, no changes to the controller were required.
Does automatic OEE tracking pay off?
In the projects implemented so far, usually quickly. The packaging manufacturer working with in.hub invested €5,900, reduced unplanned downtime by 15 % and recovered the cost after four months. At RAFI Hungaria one signal light per line was enough, and OEE on one line rose by 8 %. At the pilot site of the ENLYZE project, OEE was 14 percentage points higher.
What should OEE software be able to do?
OEE software should pick up states, part counts and scrap automatically, calculate OEE live and show it on a dashboard at the line. Downtime reasons, alerts on deviations and reports without manual work matter too. Data should flow into ERP and MES through open interfaces such as REST, MQTT or SQL. With Itanta Analytics, the dashboards were built without any programming.
Do I need an MES for OEE?
No, not to get started. At RAFI Hungaria many assembly lines were not connected to an MES, yet OEE still came from the test device signals. Many solutions come with their own dashboards. If you have an MES or ERP, the values can be passed on to it, as in the in.hub project with its ERP connection.