Consumption Data Collection and Visualization
Consumption data capture continuously collects measured values for energy and media consumption and presents them centrally in a visualized form. Consumption trends and statuses are clearly prepared and made traceable over defined time periods.
These people have implemented this use case
Contacts from our partner companies. Open a profile to get in touch directly.







Assets where this use case was implemented
Machines, devices and plants from the solution examples. The number shows how often.
How have other companies implemented this use case?
Discover solution examples from our network
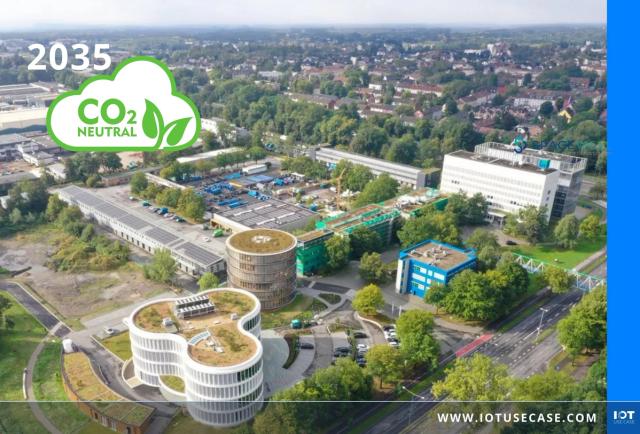

Detecting energy anomalies in buildings with AI to cut consumption
Gelsenwasser captures electricity, gas and water use in its own buildings automatically. The AI tools Optimise and Detect flag anomalies and show where energy can be saved.
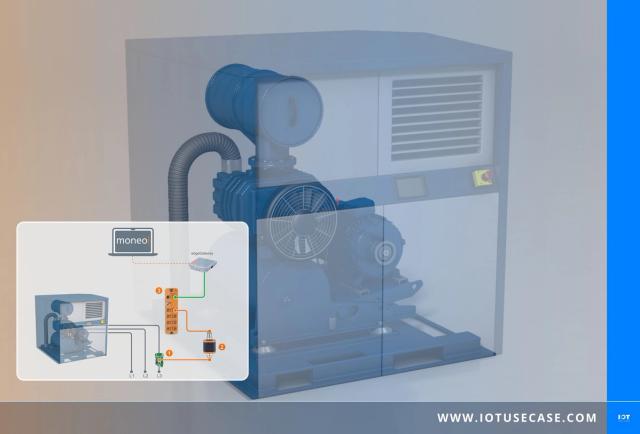

Detecting compressor operating states based on current consumption
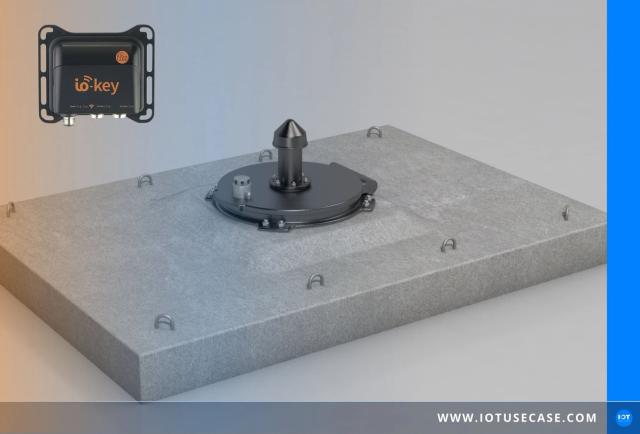
Water well level monitoring via IO-Link and cellular remotely
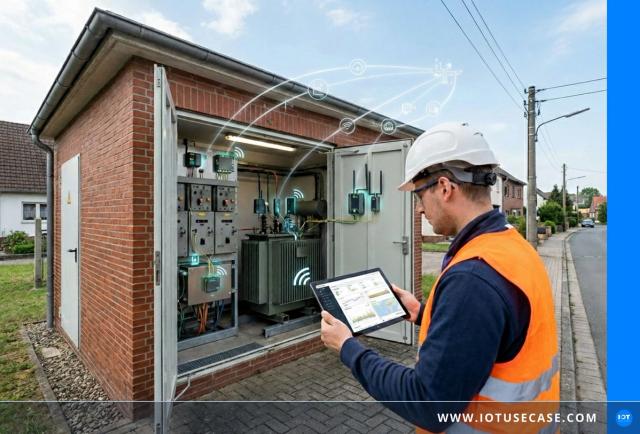


Digital grid monitoring for low-voltage networks through an IoT platform
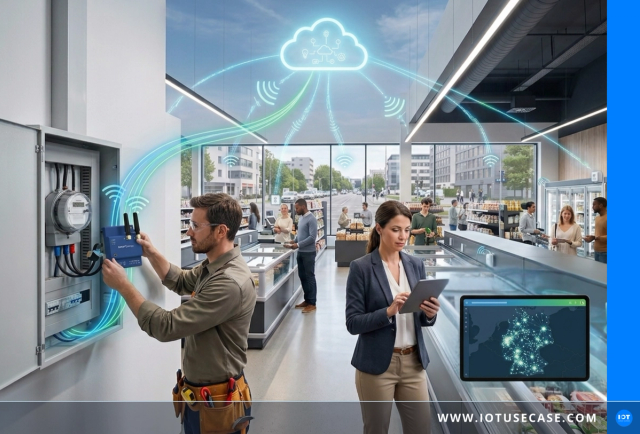

IoT energy monitoring creates cross-site transparency
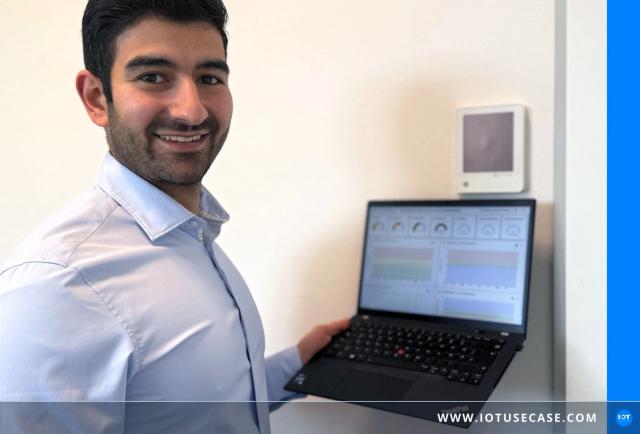

Smart Heating with LoRaWAN®: Reduce heating energy by up to 30%
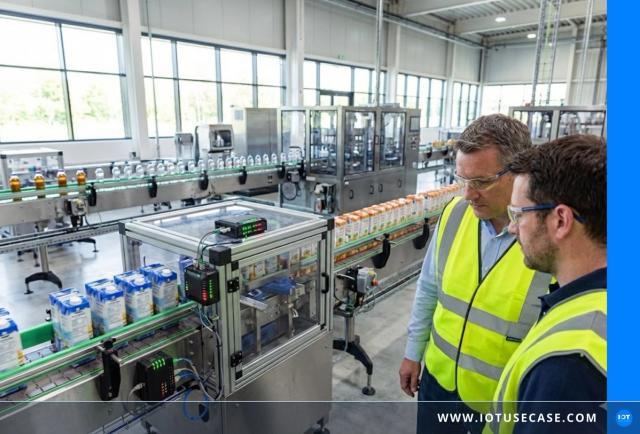

OEE transparency in packaging production – 15% fewer downtimes
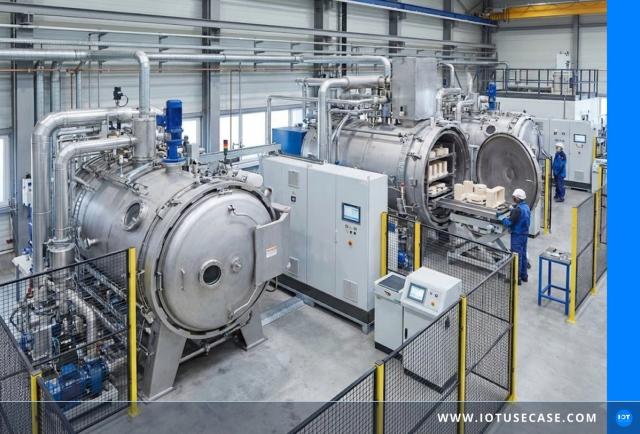





From machine to customer portal – clear data interfaces for service and customer integration
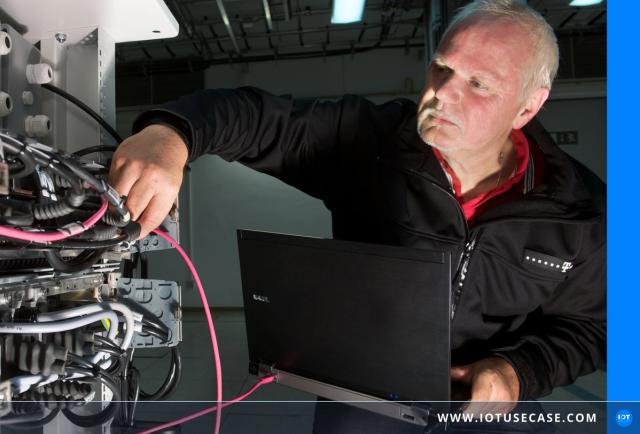

IoT-based energy monitoring for efficient fault management
This use case has already been implemented. We know the people behind it.
Just ask us. We look up how your use case has already been implemented and put you in touch personally.
IoT Building Blocks


Have a concrete IoT project in mind?
We know the vendors who've already done it.