
Tracking, visualizing, and analyzing energy consumption per unit
Energy consumption is captured on a per-unit basis, for example per machine, system, device, or usage unit. The measurement data is centrally visualized and evaluated so that consumption trends, peak loads, and deviations are clearly displayed. The analysis enables a structured examination of energy use and consumption development at various levels.
These people have implemented this use case
Contacts from our partner companies. Open a profile to get in touch directly.









Assets where this use case was implemented
Machines, devices and plants from the projects. The number shows how often.
How have other companies implemented this use case?
Discover verified projects from our network
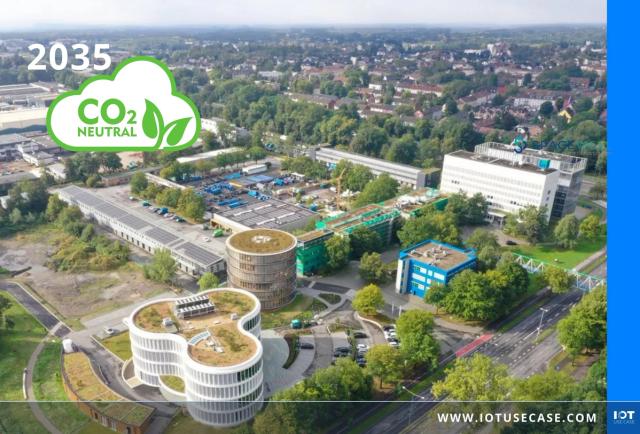


Detecting energy anomalies in buildings with AI to cut consumption
Gelsenwasser captures electricity, gas and water use in its own buildings automatically. The AI tools Optimise and Detect flag anomalies and show where energy can be saved.
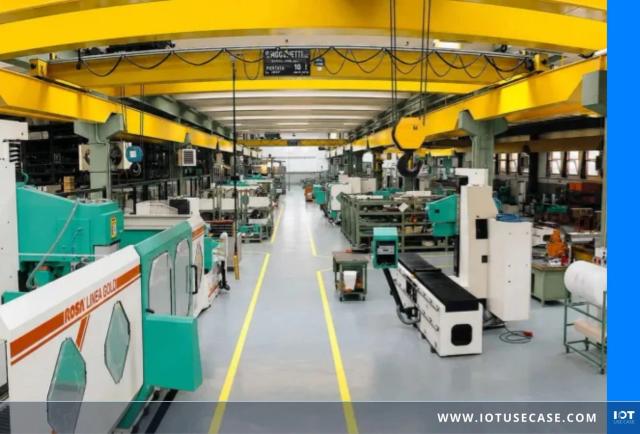


Replacing service silos with one platform to fix faults remotely
Rosa Ermando replaces scattered service silos with the symmedia Hub. Around 60 percent of software problems on its grinding machines are now solved remotely.
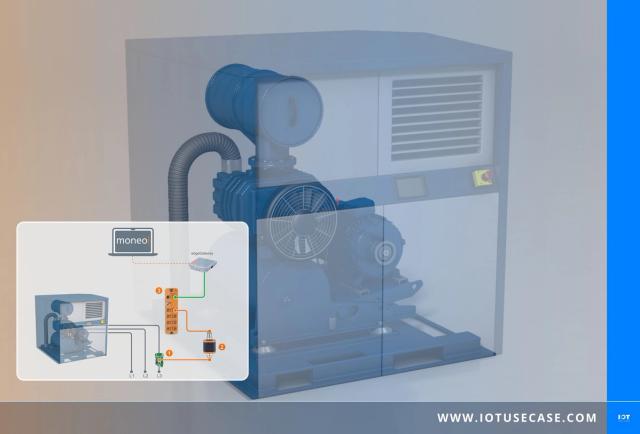



Detecting compressor operating states based on current consumption
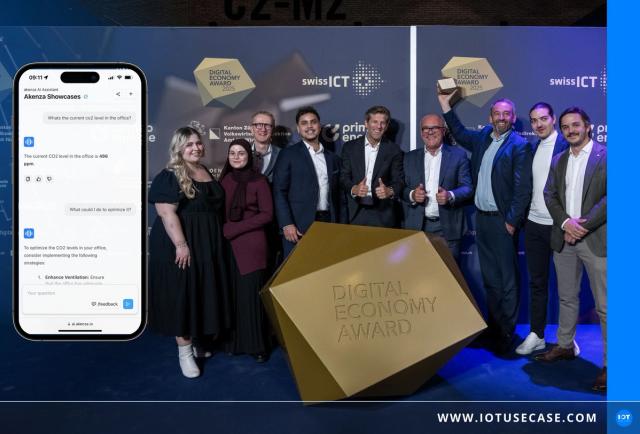


Turning building data into instant answers with an AI assistant
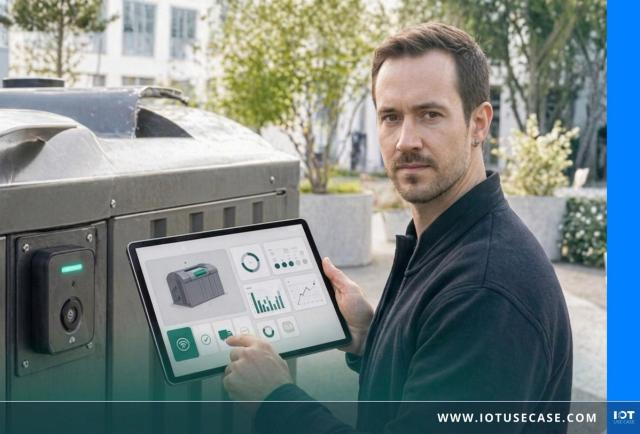


Usage-based billing with digital twins — demonstrated in waste management
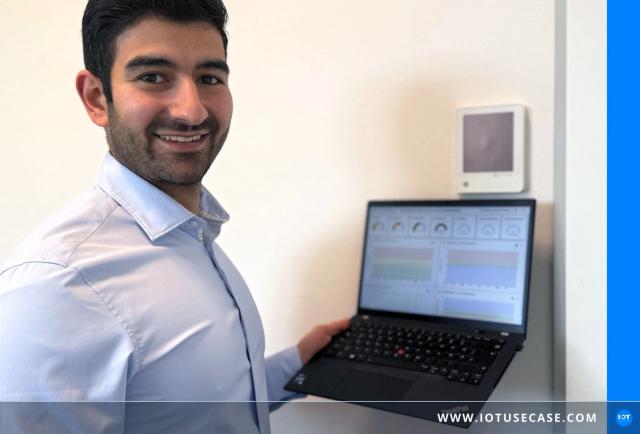

Smart Heating with LoRaWAN®: Reduce heating energy by up to 30%





OPC UA Andon visualisation keeps assembly and logistics in sync



Compressed air monitoring in a food plant – 17% lower energy demand
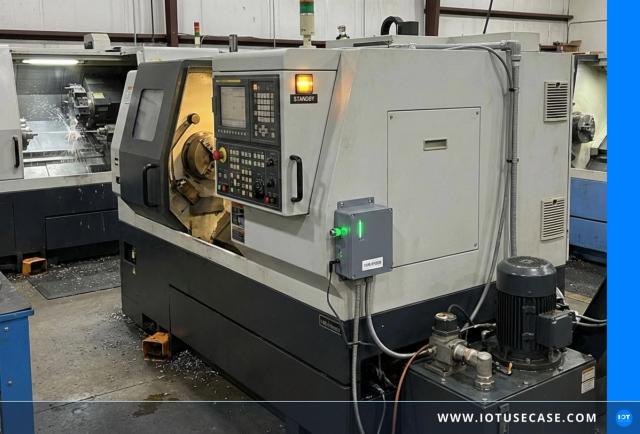
Automatic standby management in machining
This use case has already been implemented. We know the people behind it.
Just ask us. We look up how your use case has already been implemented and put you in touch personally.
IoT Building Blocks


Have a concrete IoT project in mind?
We know the vendors who've already done it.