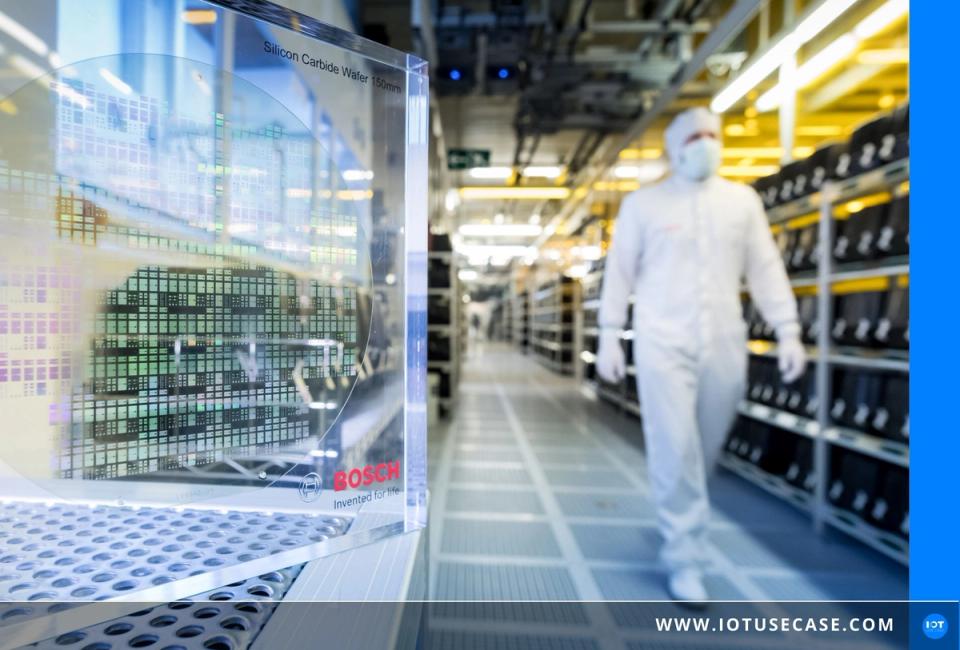


Semiconductors are the key technology of the connected world and are embedded in the form of microchips in virtually every technical device. Bosch is one of the world’s leading semiconductor producers – Bosch chips are now installed in smartphones, TVs, dishwashers and in almost every car worldwide. To meet growing demand, Bosch built a 200mm semiconductor factory in Reutlingen in 2010. In a complex manufacturing process lasting up to 14 weeks, finished semiconductor chips are produced there from silicon raw wafers.
The highly complex production extends over a large area that is divided into corridors for the individual production steps. People and machines are strictly separated spatially. In order to get an overview of progress in the individual phases and to be able to identify any problems, employees have to walk through the individual corridors on foot. This not only results in a great deal of time. Disruptions and errors are only detected after some time, and therefore often too late. And at the end of the day, production output doesn’t meet expectations.
The challenge: using data that is already available for centralised real-time visualisation
It was therefore very important to Bosch to offer employees real-time information at a central location, e.g. to inform them about disruptions or maintenance work taking place.
Bosch has of course long been familiar with visualisation solutions in a wide range of areas. However, these each served different requirements and ran in parallel. It was therefore impossible to cover all the desired requirements with one of the existing systems. A new, dedicated IT project would have been required, which was rejected due to the high effort involved.
For this reason, an externally sourced, universally applicable visualisation solution was sought and found in Peakboard. Immediate availability, universal applicability and the ability to visualise data from a wide variety of sources in real time were the decisive factors in this decision.
The solution: target/actual comparison of individual production steps using various Andon boards
Peakboard was founded in 2016 with exactly this aim: to visualise operational data simply and efficiently in real time on displays in production or logistics.
It is an intelligent, low-maintenance all-in-one solution consisting of software and hardware. Data is sourced from a wide variety of sources, from sensors and Excel to SAP or data integrators such as Theobald Software. This requires no IT resources: the user uses the Peakboard Designer, a software tool that can be downloaded free of charge from the internet, to decide which information should be displayed in which design. Numerous templates help with this, but modelling according to your own needs is also easily possible. And since Peakboard is a low-code solution, this works even without any programming knowledge.
The Peakboard Box is then connected to the desired monitor via an HDMI cable and connected to the company network via WLAN. Using this Peakboard Box, a powerful single-board computer, the finished visualisation is played on the monitor autonomously and in real time in the previously defined details. In this specific case, Bosch had already defined its requirements and the desired type of presentation in advance. A first dashboard was created in a workshop with the Peakboard specialists, and the integration into the system could be realised within just a single working day.
The result: process overview and a universally applicable data visualisation solution with integration of all required data sources
In contrast to BI systems, which are designed for the analysis of historical data, Peakboard visualises currently running processes. Depending on the specification, the viewer immediately gets the required information to make quick and independent decisions. Only this allows reactions to requirements and events with the required response time and agility.
This first use of Peakboard was a complete success for Bosch. Not only were time-consuming inspection rounds no longer necessary, but the information updated every 30 seconds was now exactly where it was needed, enabling rapid intervention from day one. Another major advantage was the quick capture of the most important information for employees returning to their workstations from a shift break. After all, production at Bosch runs around the clock in shift operations, and there are often multi-day breaks in between. Only with the Peakboard dashboard was it possible to immediately capture all important information quickly and efficiently, because the visualisations are structured according to the same principle everywhere.
More than 20 Peakboard dashboards are now in use. Due to the unlimited design options, other areas have expressed interest, as the advantages are obvious:
- universally applicable data visualisation solution,
- display of data in real time,
- seamless integration of all required data sources,
- direct connection to the Oracle server,
- simple, quick adjustments without IT resources.
More information at Peakboard: peakboard.com/success-stories/robert-bosch-gmbh/